Explore Matches
Explore schema alignment candidates using the BDIViz interactive heatmap interface.
Overview 🔍
After uploading your files, BDIViz launches its main interface, allowing you to visually explore match candidates between your source dataset and the target schema.
Interactive Heatmap 🔥
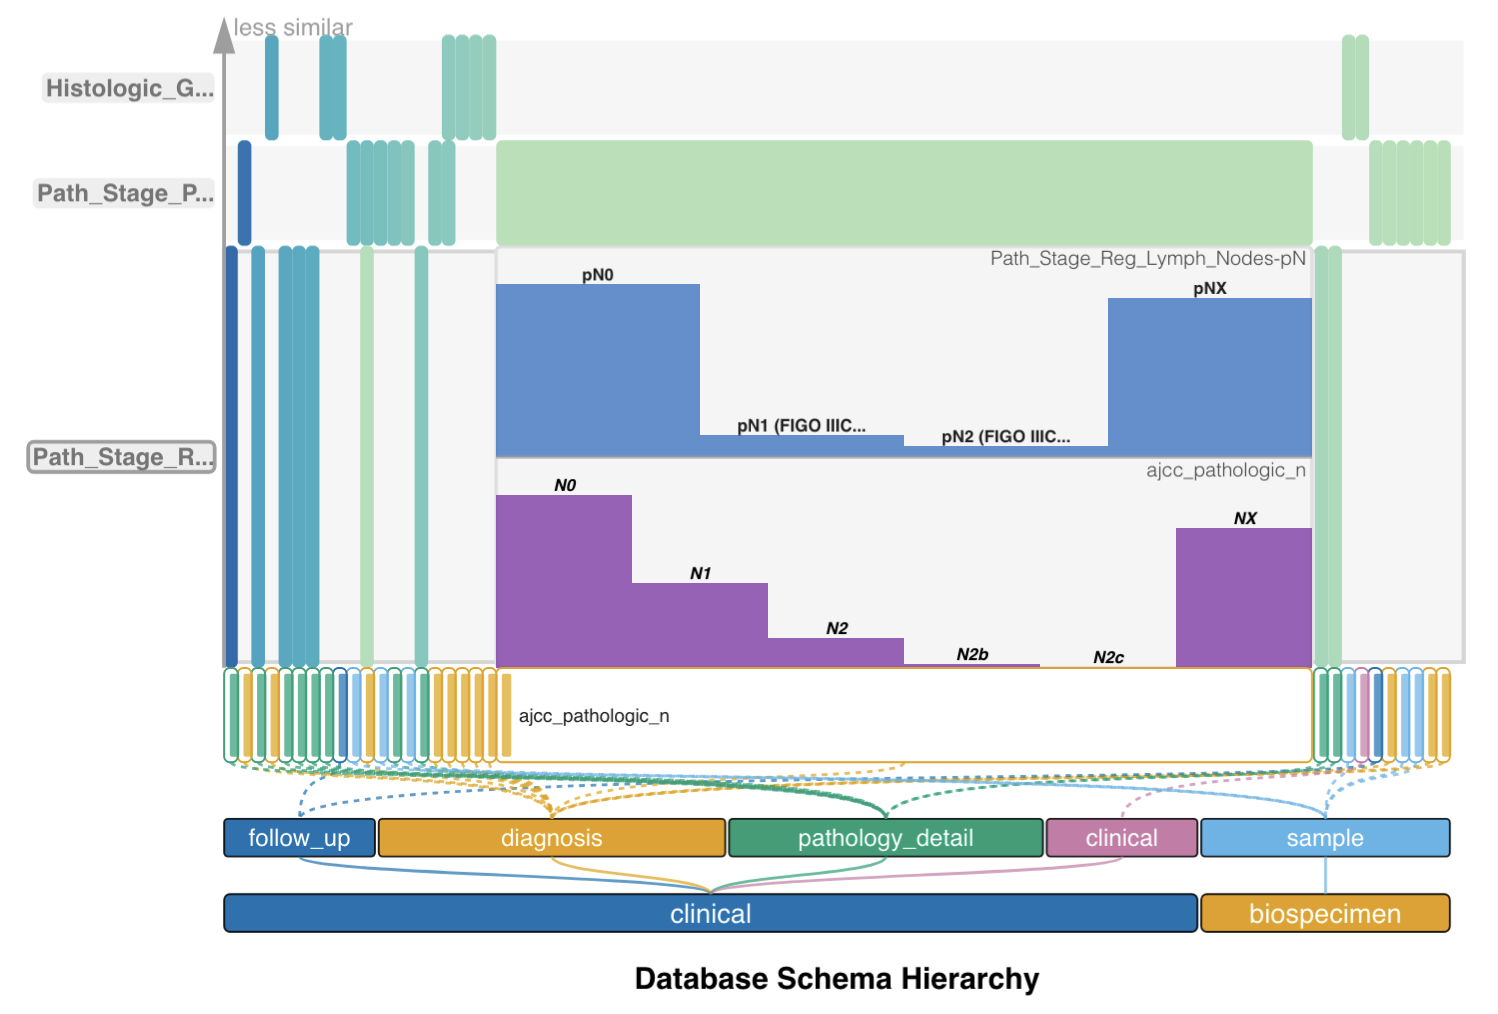
The heatmap is the primary visualization tool in BDIViz. Each cell represents a match candidate between a source attribute (y-axis) and a target attribute (x-axis).
Key Features
Each cell corresponds to a potential match:
- Color intensity indicates similarity score (darker = stronger match).
- Green = accepted match, Red = rejected match.
- Click on a cell to inspect match details.
The x-axis displays the target schema’s structure as a semantic hierarchy:
- Category Level: e.g.,
clinical,biospecimen - Node Level: e.g.,
diagnosis,treatment - Leaf Nodes: individual target attributes
Color and curved connectors help clarify relationships and improve navigation.
Clicking a heatmap node reveals a stacked histogram panel:
- Top Chart: Source column value distribution
- Bottom Chart: Target column value distribution
Use this to evaluate whether the two columns share meaningful overlap.
Tip: Similar distributions (e.g., shared categories like “Male” and “Female”) often suggest semantic alignment.

The top-level filter tabs help narrow your focus:
- All: View all candidate matches
- Accepted: Only show confirmed matches
- Unmatched: Only show source columns with no confirmed match
- Expand on Hover: Toggle whether expanded histograms appear on hover or click
Filters and Search Controls 🔍
Fine-tune the heatmap view using a suite of filters:
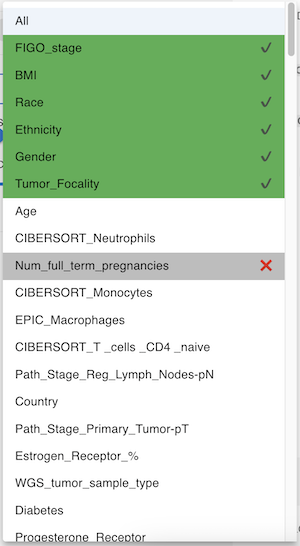
Select a specific source column to examine.
Dropdown key:
- Green: Already matched
- Grey: Manually discarded
- All: Show all source attributes
Set a minimum similarity score for visible candidates. Range: 0.0 – 1.0.
0.0: Show all matches1.0: Show only perfect matches
Controls how many similar source attributes appear on the heatmap when a single source column is selected.
Note: Only applies when Source Attribute ≠ “All”.
Quickly locate and highlight target attributes by name or keyword.
Lower Panel: Match Details 🔎
Clicking on any heatmap node reveals deeper insights below:
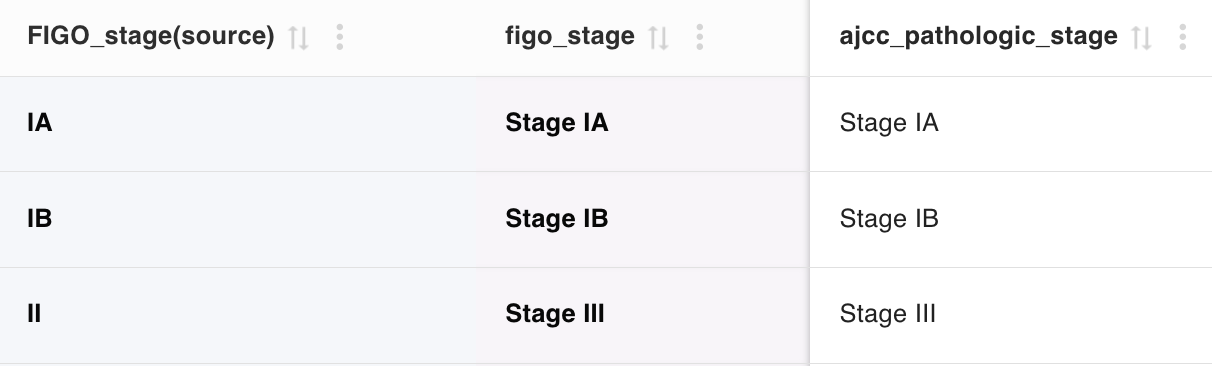
Visualizes string-based fuzzy matching between source and target values.
- Each row: one source value + its closest matches
- Use to validate whether mapping is semantically and syntactically justified
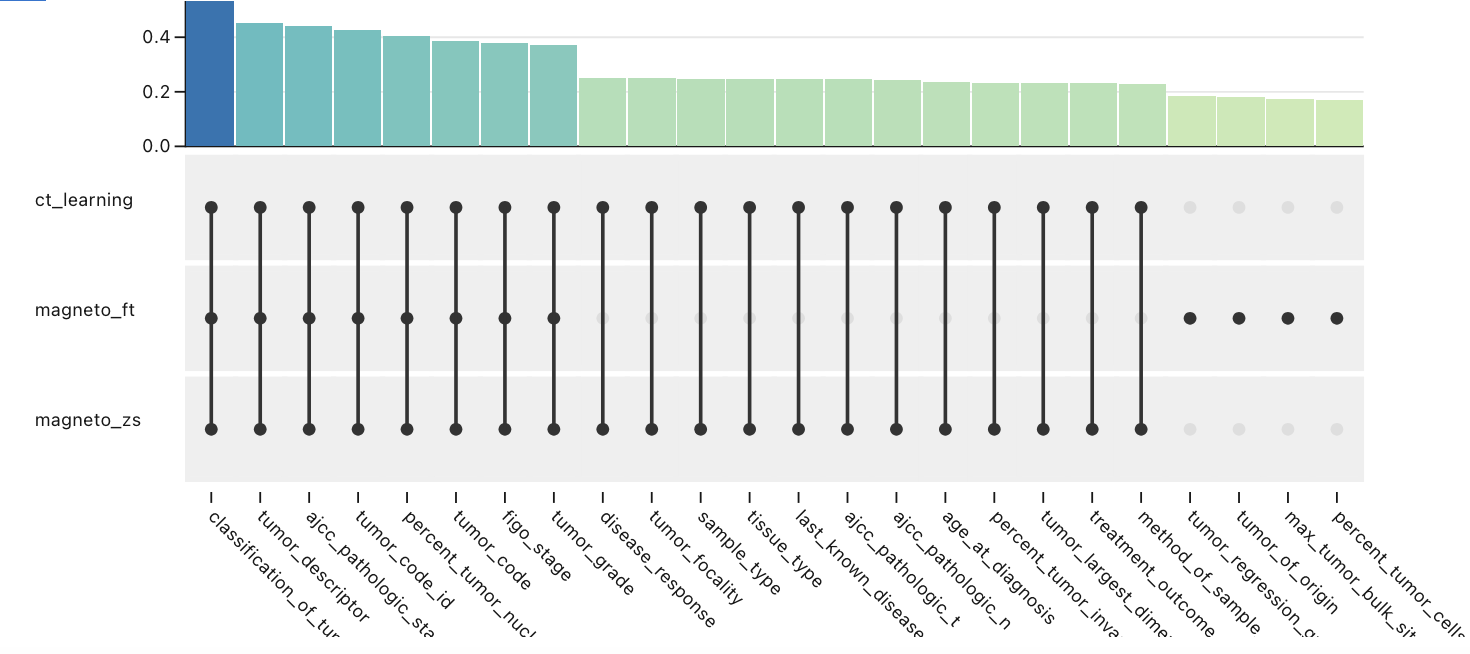
Visualizes how different matchers contributed to the candidate match score.
- Each row: a matcher
- Each column: a candidate
- Dots indicate support from that matcher
What’s Next? 🚀
After reviewing the matches:
- Accept or reject individual match suggestions
- Use filtering to prioritize high-confidence matches
- Proceed to export, refine, or apply your matched schema for downstream harmonization tasks